We monitor the depth of the water in our well via a system I built last year. The level rose rapidly at the end of last year (from ~3 feet of water to ~10 feet of water) during the heavy rains, so I decided to plot a chart of water depth and rainfall to see what it looked like.
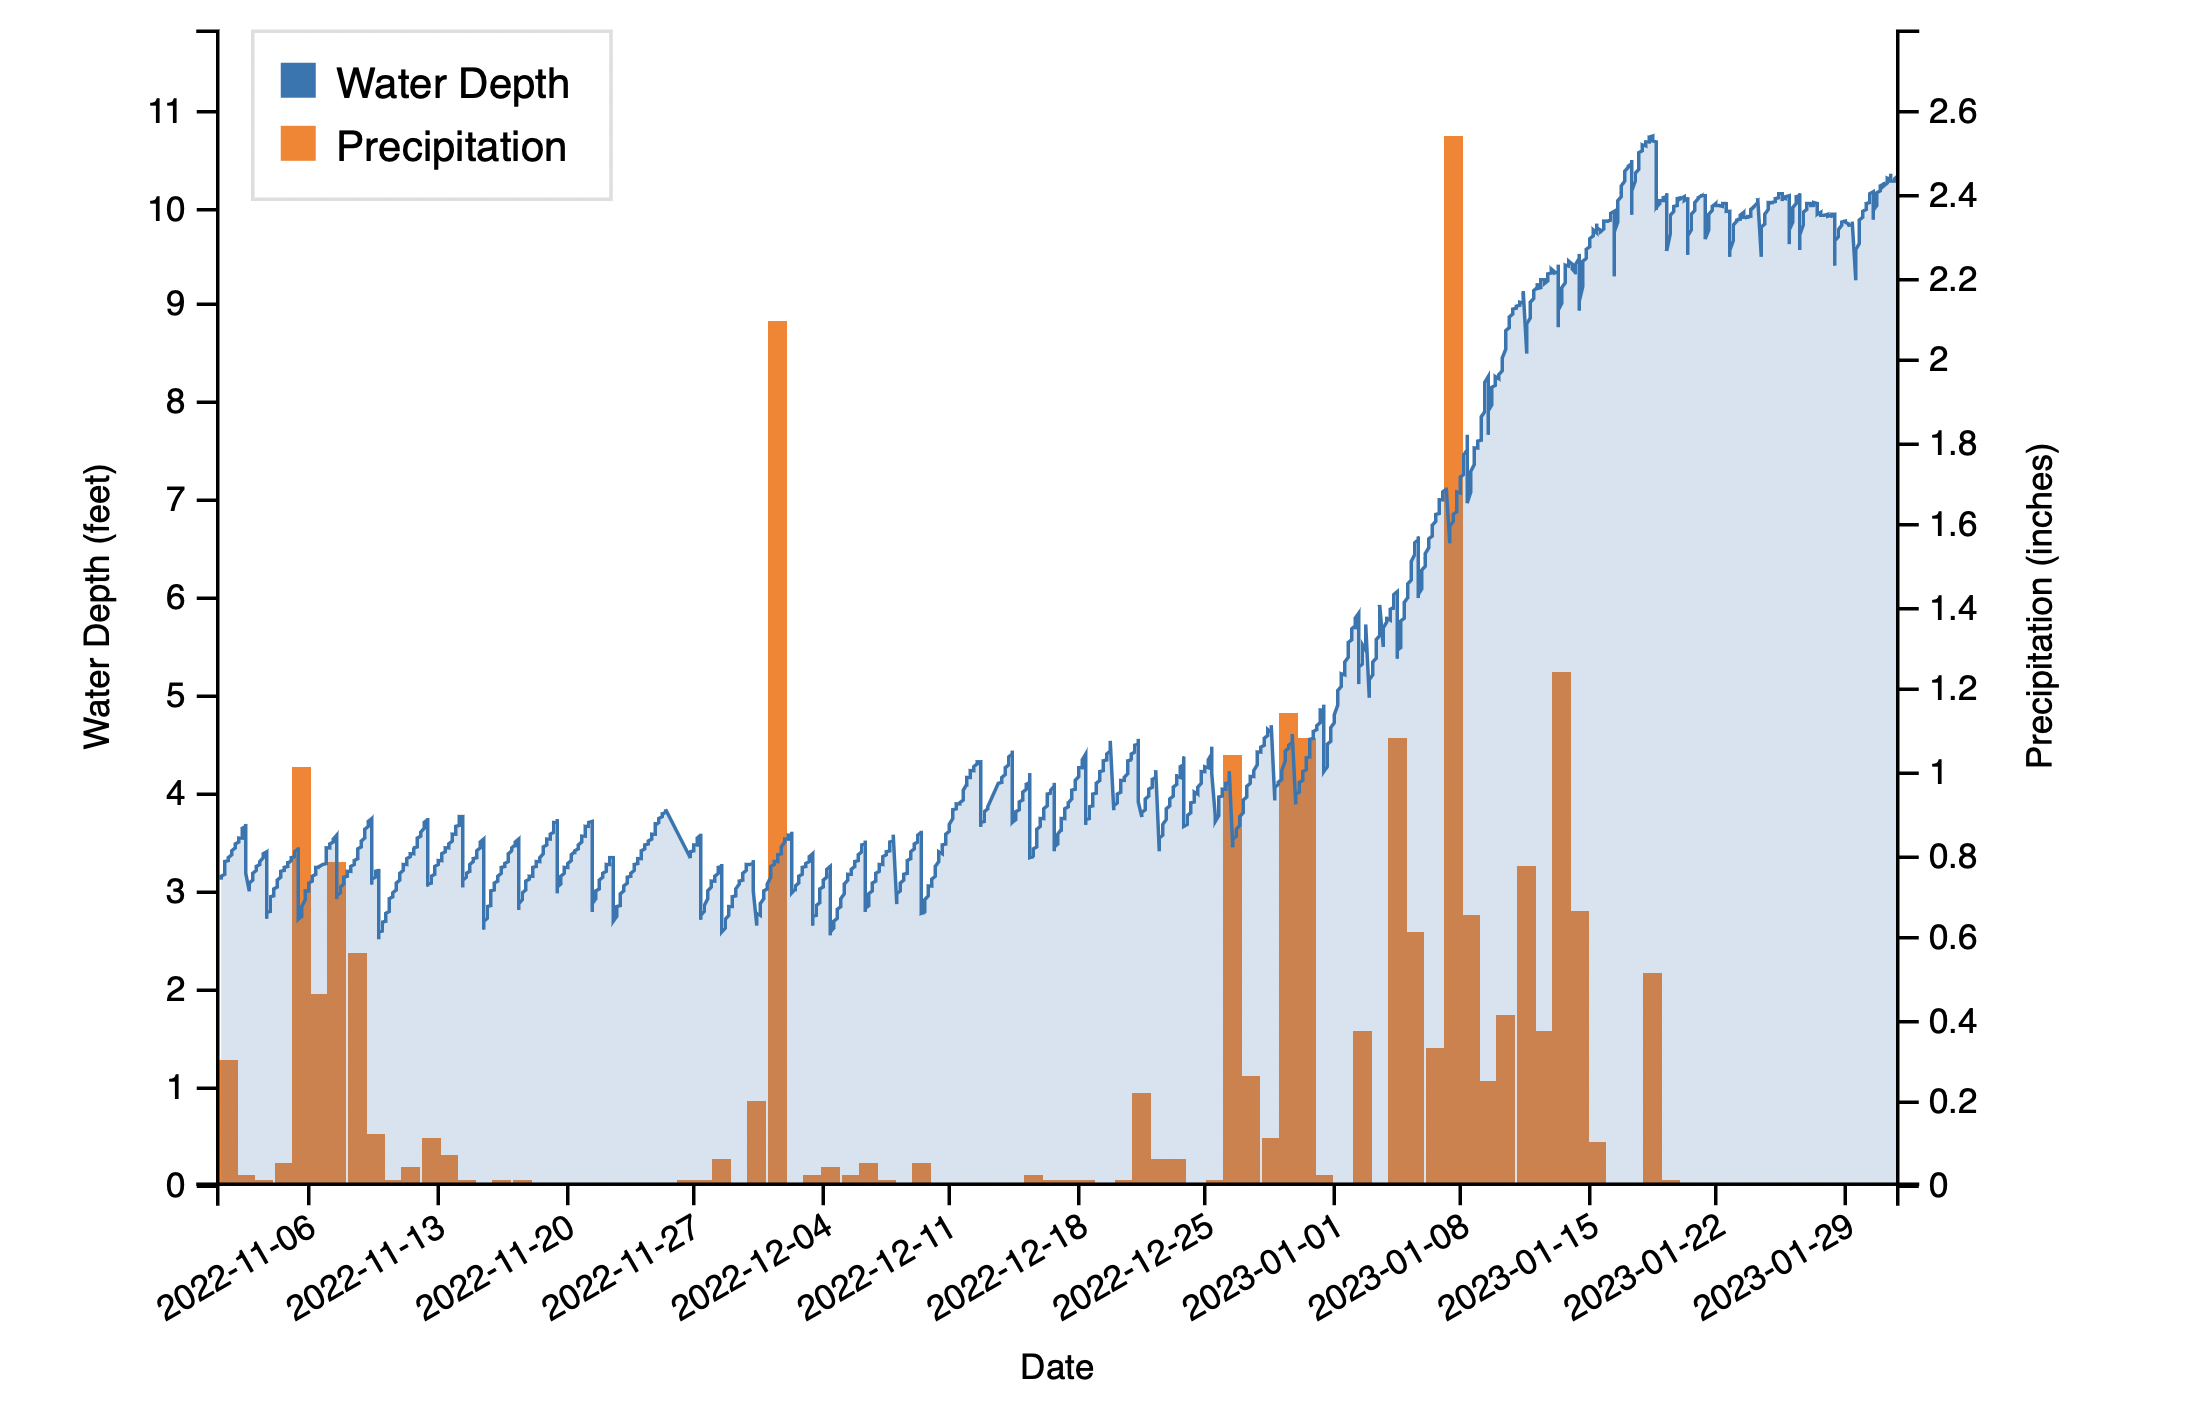
I used precipiation data from the Mendocino KCAMENDO1 Weather Underground station, which is the closest station to our house. Here's a plot of depth of water (in feet) along with precipitation (in inches) from 1st Nov 2022 to 31st Jan 2023:

Chart of rainfall and water level in our hand-dug ~20-ft-deep well in Mendocino, CA. PNG version of the chart here.
The rains in early Nov and early Dec don't seem to do much for the water level, but the continuous heavy rain around Christmas and New year correspond to a rapid rise in the level.
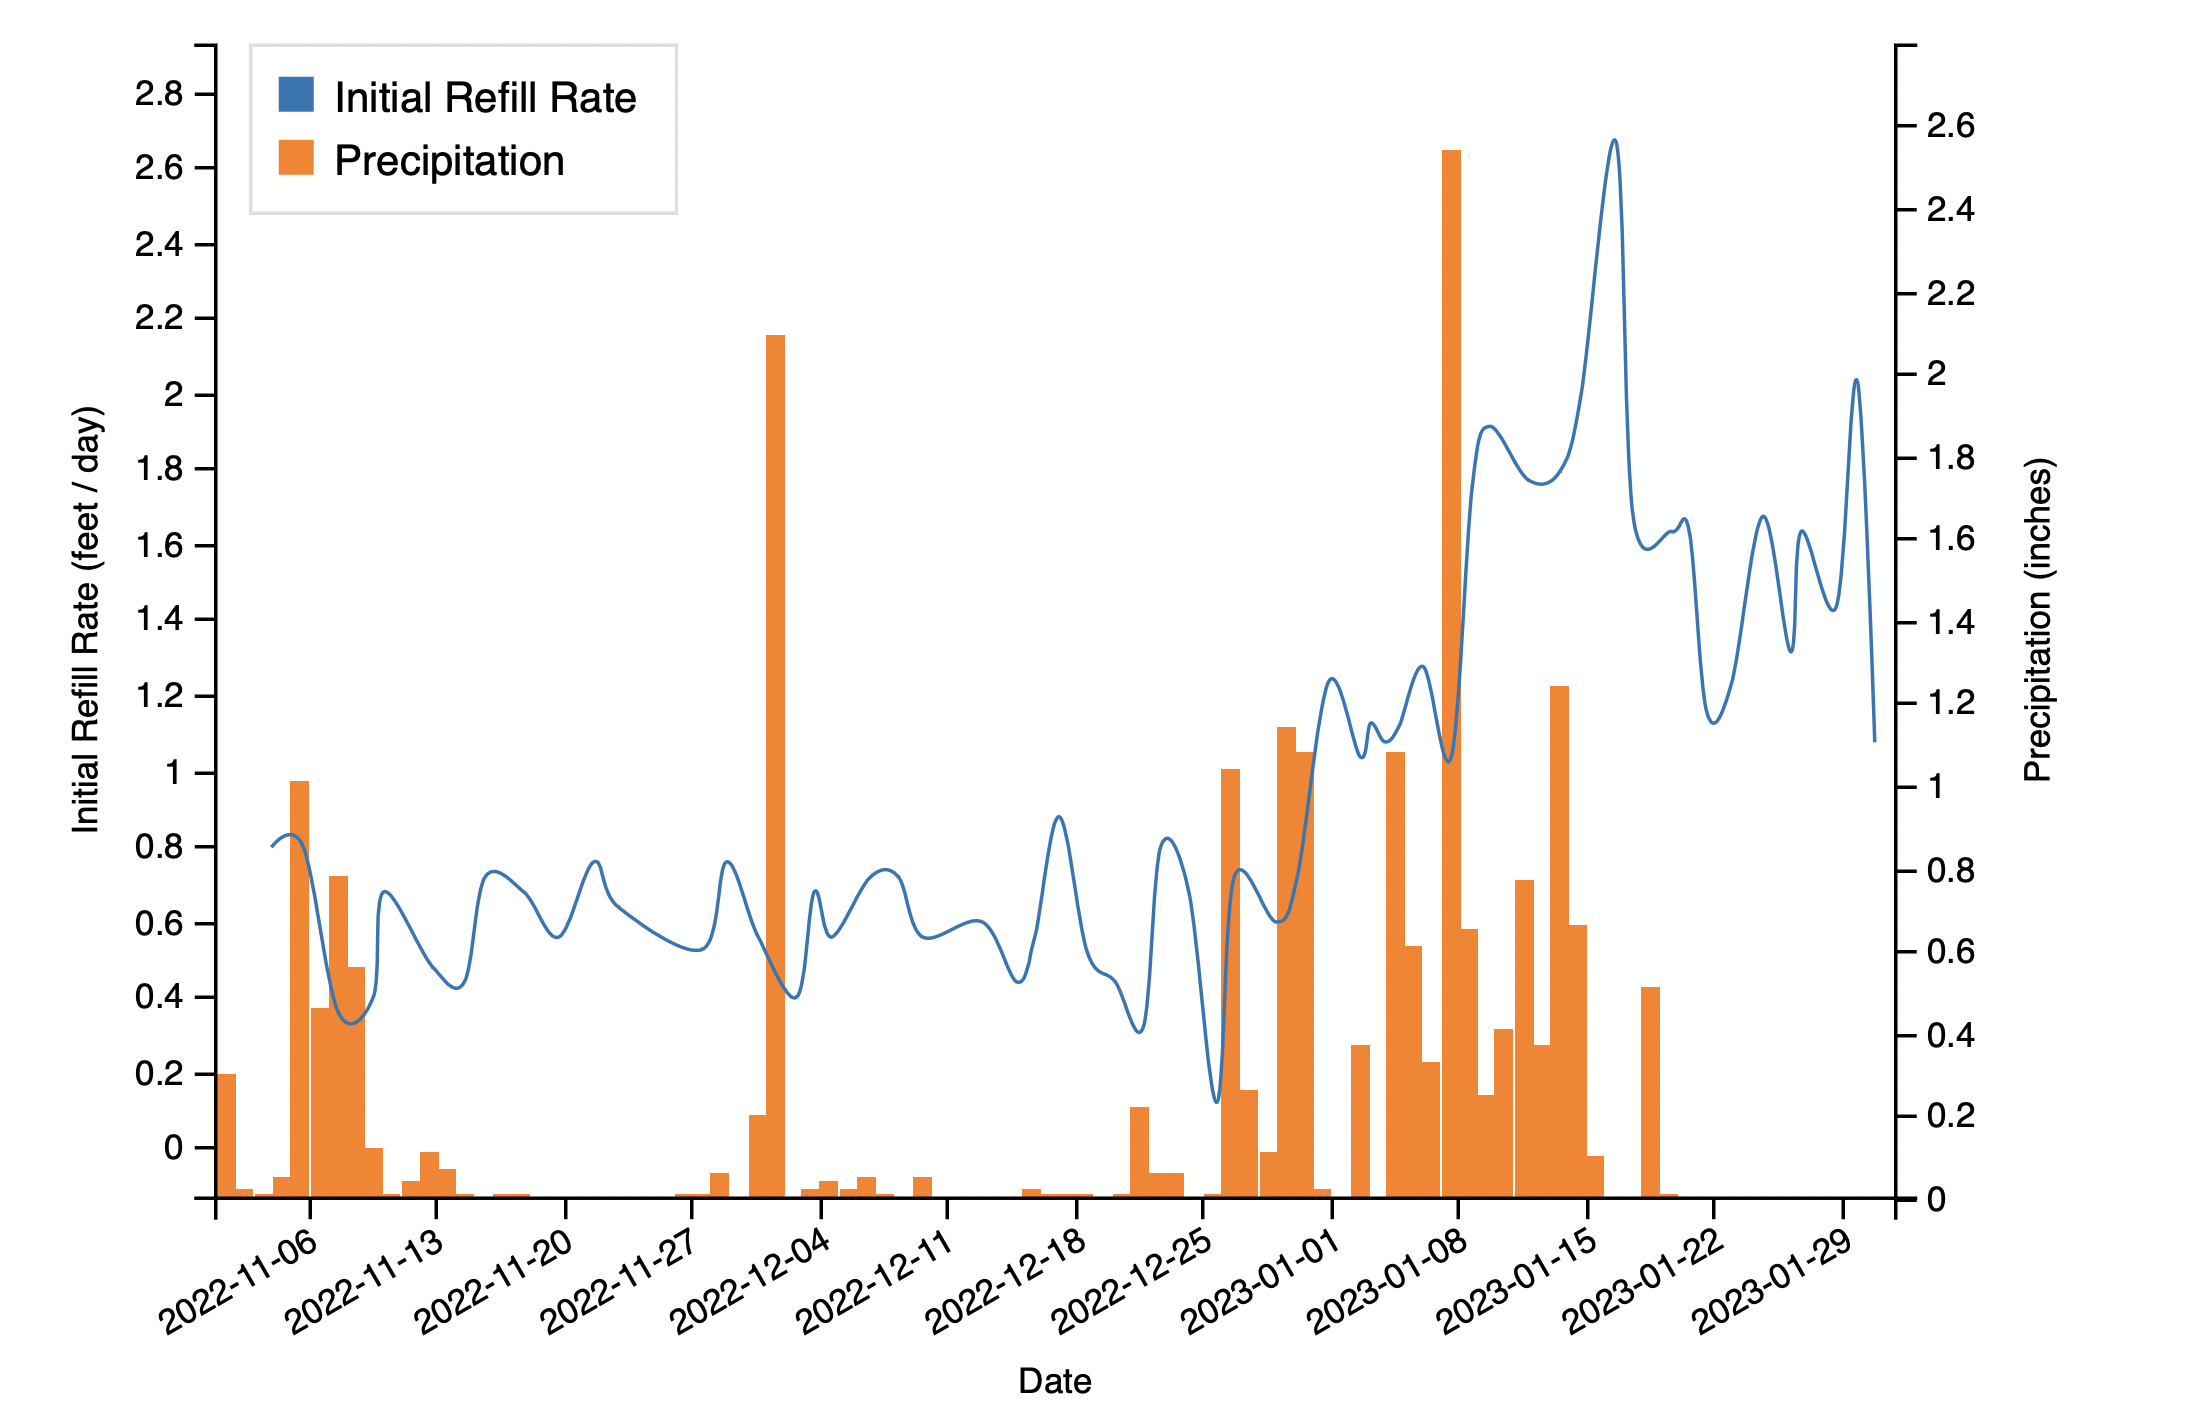
You can also see from the chart that the water level sawtooths up-and-down every day or two as the well refills after we pump out our household water. Prior to the heavy rains the well would refill at a rate just about sufficient to reach it's previous level before the next pumping. During the heavy rains the well started to refill at a much faster rate. I plotted the initial refill rate (that is, how fast the water level rises in the first 6 hours after a pumping, in feet per day) over time too:

Chart of initial refill-rate (first 6 hours after a pumping) and water level in our ~20-ft-deep well in Mendocino, CA. PNG version of the chart here.
The initial refill-rate averages at around 0.6 ft/day prior to the end of the year, but then shoots up to over 2 ft/day. Even now, after the water level has settled around 10 ft, it still refills much faster than before.
Another interesting thing you can see in the first chart (and a little better in the charts from the previous post) is that the well now seems to rapidly reach an equilibrium level in between pumpings. Why that should happen now, at this higher level, when it didn't at the lower level, is not obvious to me. No doubt it is related to the shape of the water table and the pressure of the water at this new level, but the exact mechanics of it elude me.
This is the first year I've had this data so it's very interesting to see how rapidly the water level rises, and how quickly that happens after the rains.